
Figure 1.
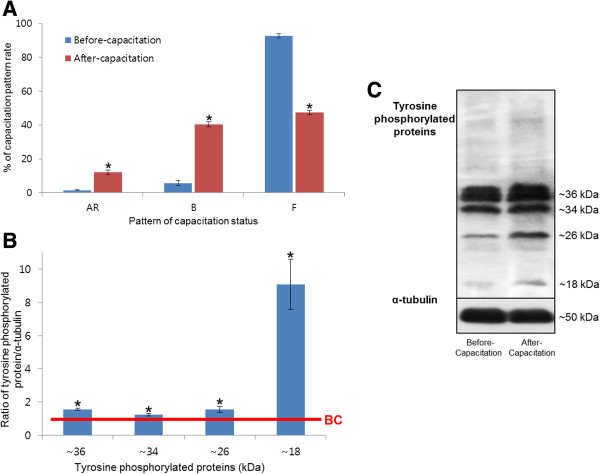
Capacitation status and tyrosine phosphorylation of spermatozoa following incubation in capacitation media. (A) Changes in capacitation pattern. Data represent mean ± SEM, n =3, *P <0.05. (B) Ratios of tyrosine phosphorylated proteins (optical density [OD] × mm)/α-tubulin (OD × mm). Data represent mean ± SEM, n =3, *P <0.05. The red line indicates the landmark of before-capacitation (BC). (C) Tyrosine-phosphorylated proteins were probed with anti-Phosphotyrosine (4G10) antibody; lane 1: before capacitation; lane 2: after capacitation.