
Figure 3.
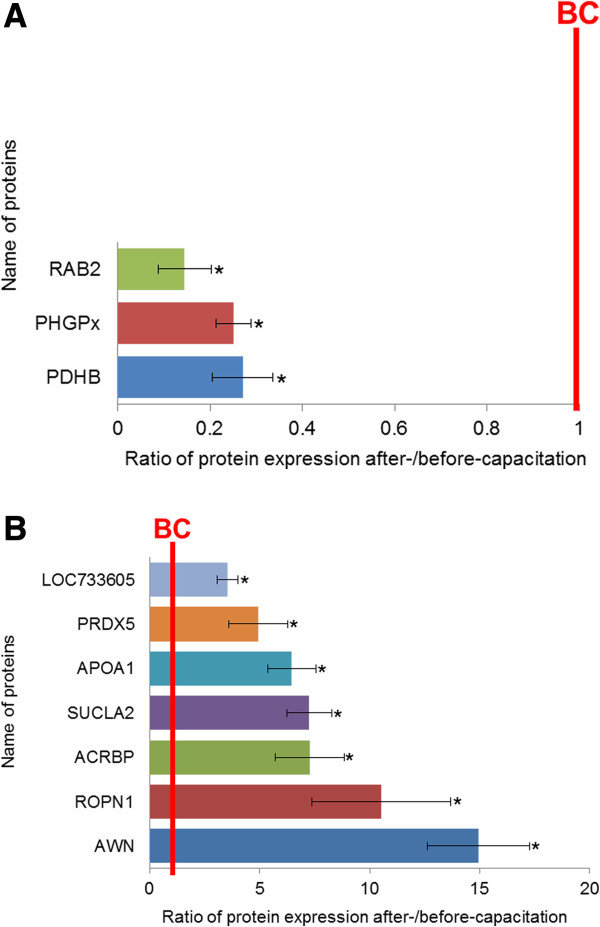
Comparison of proteins from before- and after-capacitation spermatozoa. Differentially expressed (>3-fold) proteins were determined by comparing before- and after-capacitation spermatozoa (* P <0.05). The line indicates the landmark of before-capacitation (BC). (A) Three proteins were significantly decreased after capacitation. (B) Seven proteins were significantly increased after capacitation. The data represent the mean ± SEM, n =3.