
Fig. 3.
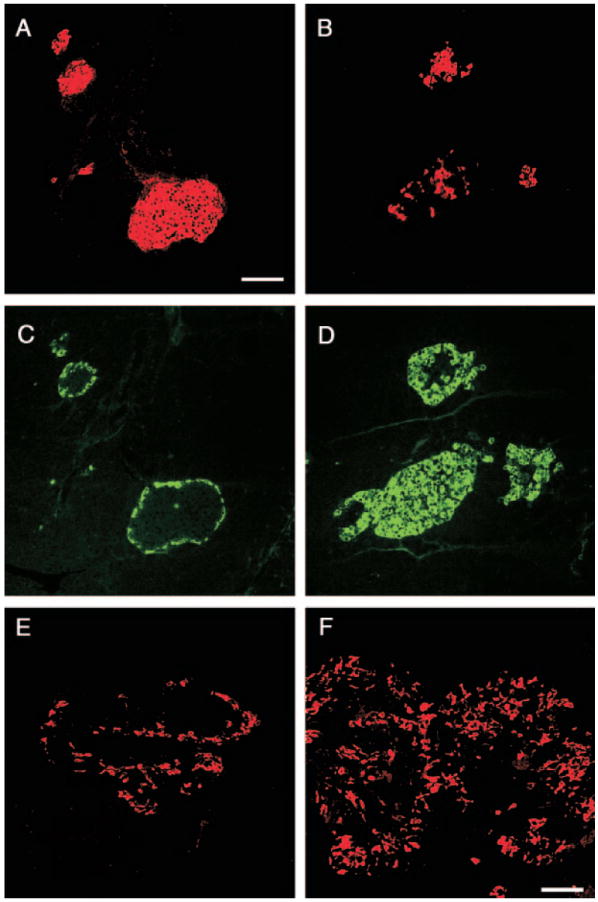
Islets of adult Gcgr−/− mice display non-β-cell hyperplasia. Photomicrographs of confocal microscope images illustrate islets from 3-month-old mice immunostained for visualization of IN (A and B), GLU (C and D), and SOM (E and F). A, C, and E, Gcgr+/+. B, D, and F, Gcgr−/− mice, respectively. Note that the number of GLU+ and SOM+ cells in islets of Gcgr−/− mice is higher than in Gcgr+/+ litter mates. Bar, 80 μm.