
Fig. 3.
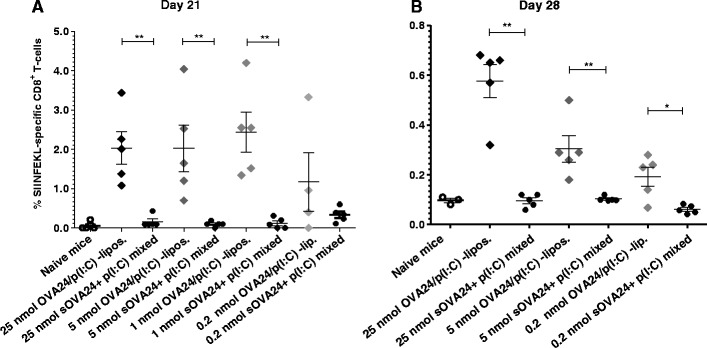
Antigen-specific CD8+ T cell responses following intradermal vaccination of C57BL/6 mice on day 0 and day 14 with different SLP doses of poly(I:C)-adjuvanted formulations, as monitored in blood on day 21 (a) and in spleens on day 28 (b). p value was calculated with one-tailed Mann-Whitney test. **p < 0.005 and *p < 0.05 (significant data). Each dot represents the response of an individual mouse (results represented as mean ± SEM, n = 5). Control mice and groups of mice immunised with 1 nmol of vaccine that are missing from panel B were sacrificed 1 day later for the need of the assay presented in Supplemental figure 2). The plus symbol denotes soluble OVA24 and poly(I:C) that are mixed, and the solidus symbol denotes co-encapsulated in liposomes compounds