
Fig. 7.
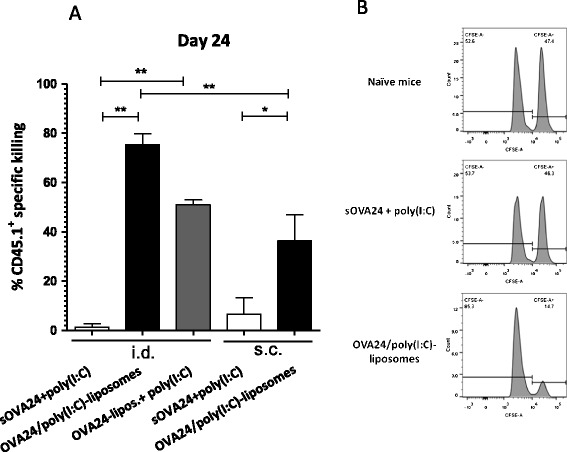
In vivo cytotoxicity assay. The normalised mean percentages (±SEM) of the killing activity are depicted based on the percentages of transferred CD45.1+ that could be detected against the control naive mice. Mice immunised with 5 nmol of OVA24 vaccine intradermally (i.d.) or subcutaneously (s.c.) (the last two bars) was monitored 1 week after the boost immunisation. The bar graphs depict the mean percentages (+SEM) at day 22 (a). Data were analysed with one-way ANOVA with Tukey’s multiple comparison test, and p value was calculated with one-tailed Mann-Whitney test. **p < 0.005, and *p < 0.05 (significant data, n = 5). Representative histograms of CFSE-labelled positive target cells (right peak = peptide pulsed and left peak = control) (b). The plus symbol denotes liposomes and poly(I:C) that are mixed, and the solidus symbol denotes co-encapsulated compounds