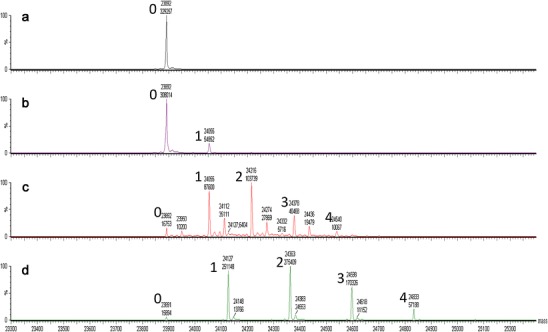
Fig. 2.

Mass spectrometric analysis of sugar derivatized mAbA. Time of flight analysis of reduced denatured light chain is shown. a underivatized, b glycated with low levels of mannose, c glycated with high levels of mannose, and d derivatized with high levels of IMT-mannose. The number to the left of the labeled peaks refers to the number of sugars attached per light chain
