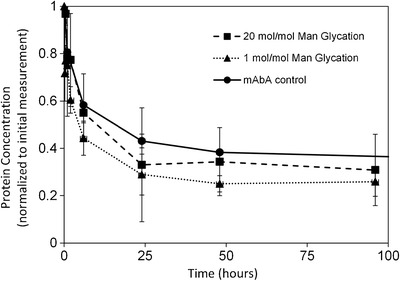
Fig. 4.

Normalized concentration versus time plots of mAbA samples in mice. Data were normalized to the initial concentration of mAbA and plotted using a linear scale to demonstrate that profiles of the various mAbA samples are within twofold. Symbols are the same as those in Fig. 3. Error bars represent ± one standard deviation
