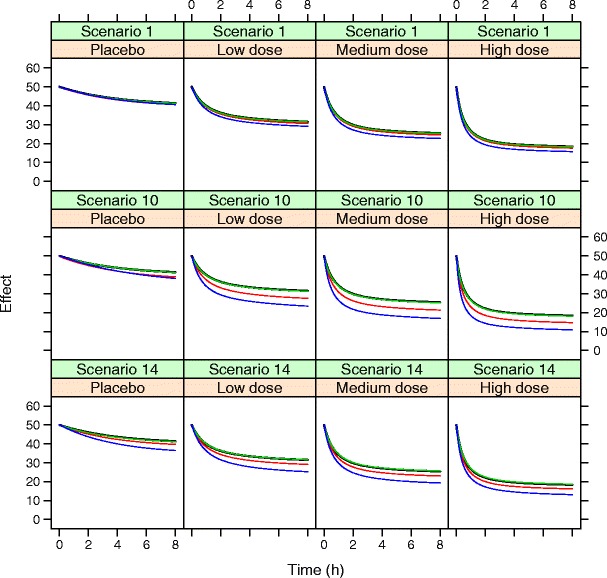
Fig. 3.

Simulated effect variable for a typical individual in the different dose groups for scenario 1, scenario 10 (observations every 4th hour only), and scenario 14 (increased dropout rate, on average 57%). Simulations are based on true parameters (black), parameters estimated with dropout model (green), parameters estimated without dropout model using Laplace (red) or FOCE-I (blue)
