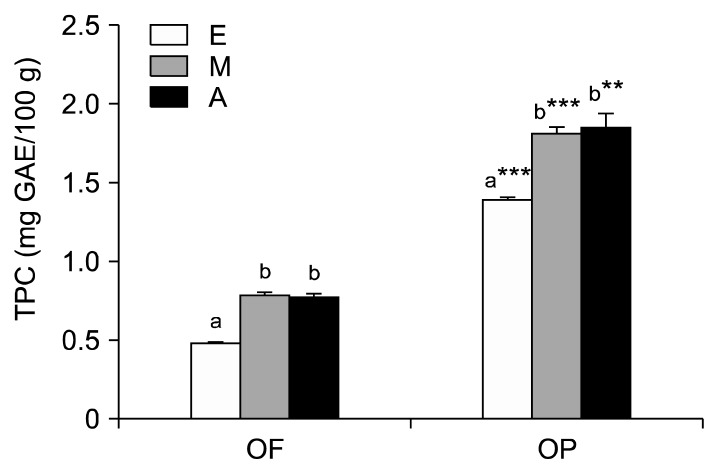
Fig. 1.
Total phenolic content of orange fruit (OF) and orange peel (OP) extracted with organic solvents. E, ethanol; M, methanol; A, acetone. Values are mean with standard deviation. Values not sharing the same letter within OF or OP are significantly different from one another (P<0.05) by Duncan’s multiple range test. **P<0.01, ***P<0.001 significantly different between fruit and peel extract by Student t-test.

