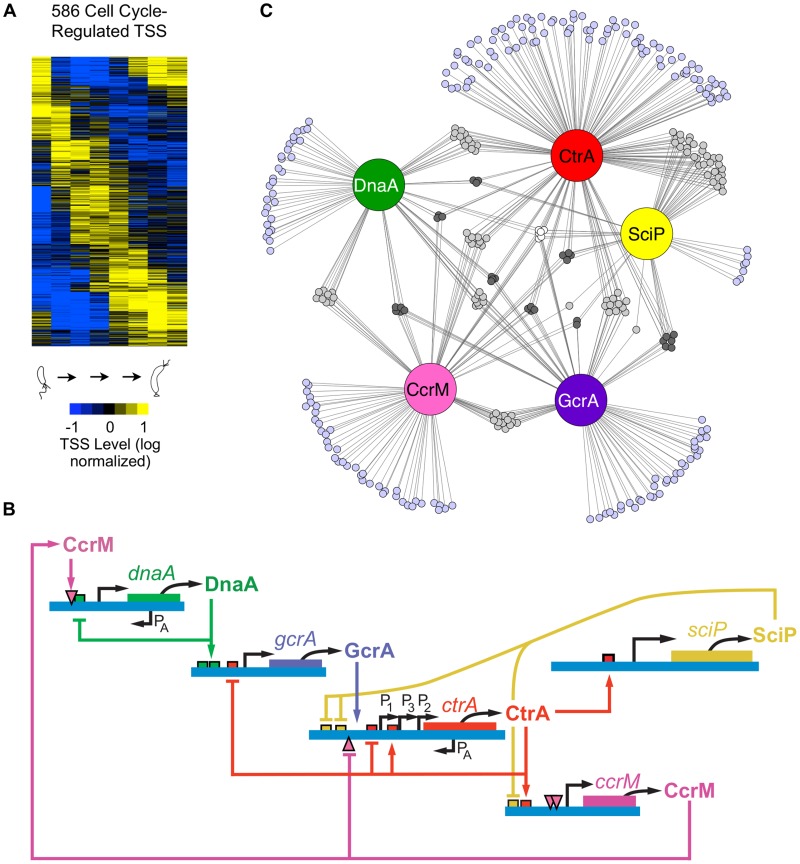
Figure 2. Cell cycle-regulated transcription by combinatorial control of master regulators.
(A) Heat map of transcriptional profiles of the 586 cell cycle-regulated TSSs. Fifteen clusters were generated using the k-means algorithm and ordered according to their maximum time of activation as a function of the cell cycle. Columns correspond to the 8 time points during cell cycle progression shown in Fig. 1A and each row reflects the expression pattern of a single TSS. The TSS expression values are log2 transformed and normalized such that mean = 0, max = 1, and min = −1. (B) The core regulatory circuit that drives the Caulobacter cell cycle. DnaA is required to initiate DNA replication, and it also acts as a transcription factor. The circuit contains transcription factors GcrA, CtrA, and SciP, as well as the DNA methyltransferase CcrM [2]. This core circuit drives cell cycle progression by orderly activation of the expression of 334 cell cycle-regulated TSSs. PA indicates antisense TSSs within dnaA and ctrA. (C) Network of master regulators (DnaA, CtrA, SciP, and CcrM binding motifs or a>3 fold enrichment of GcrA Chip-seq signal [26]) in promoter regions of 334 cell cycle-regulated TSSs. Each promoter is represented by a small circle and each line represents interaction by a corresponding regulatory factors in a large colored circle. Promoters with ≥4 master regulators are white, 3 master regulators are dark grey, 2 master regulators are light grey, and 1 master regulator are light blue.

