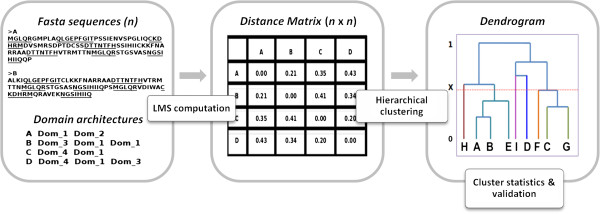
Figure 1.

Schematic of the CLAP server. Left panel - The inputs to the server are: a set of n protein sequences (Fasta format), a tree parsing cut-off ‘×’, between 0 and 1 (optional) and a tab-delimited file containing domain architecture details for each protein file (optional). Middle panel - A pairwise sequence comparison is performed using the Local Matching Scores method and a normalized distance matrix is computed. Right panel - This distance matrix is subjected to hierarchical clustering using Wards method. The resulting dendrogram is parsed using the user specified cut-off ‘×’. The clusters obtained are analyzed for similarities in domain-architectures.
