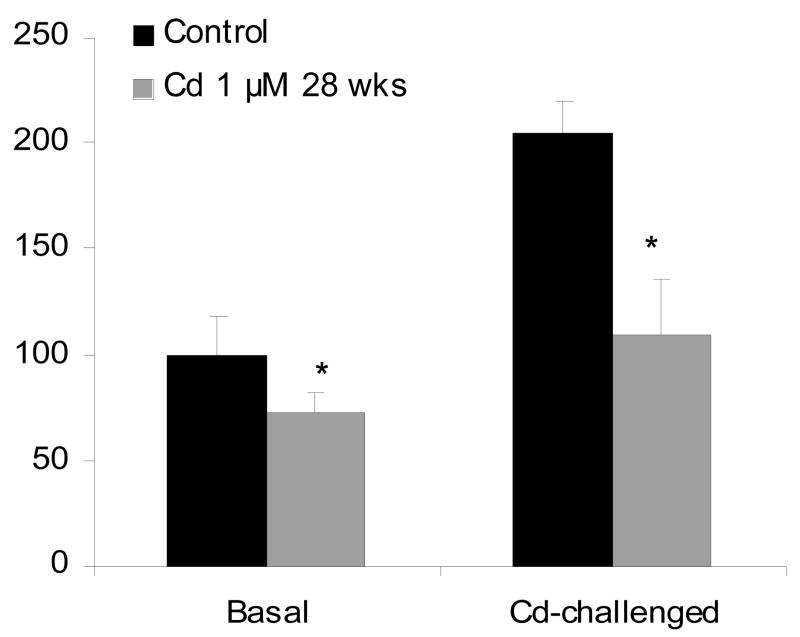
Figure 2.
Cadmium-induced ROS generation in control and Cd-transformed rat liver cells. Cells exposed to 1.0 μM Cd for 28 weeks and passage matched control cells were treated with 50 μM Cd for 60 min in the presence of 3 μM dihydroethidium for the production of superoxide anion O2 for 20 min. The fluorescence images were captured with a confocal microscope. Data represent mean ± SEM of three determinations. *Significantly different from controls, p<0.05.

