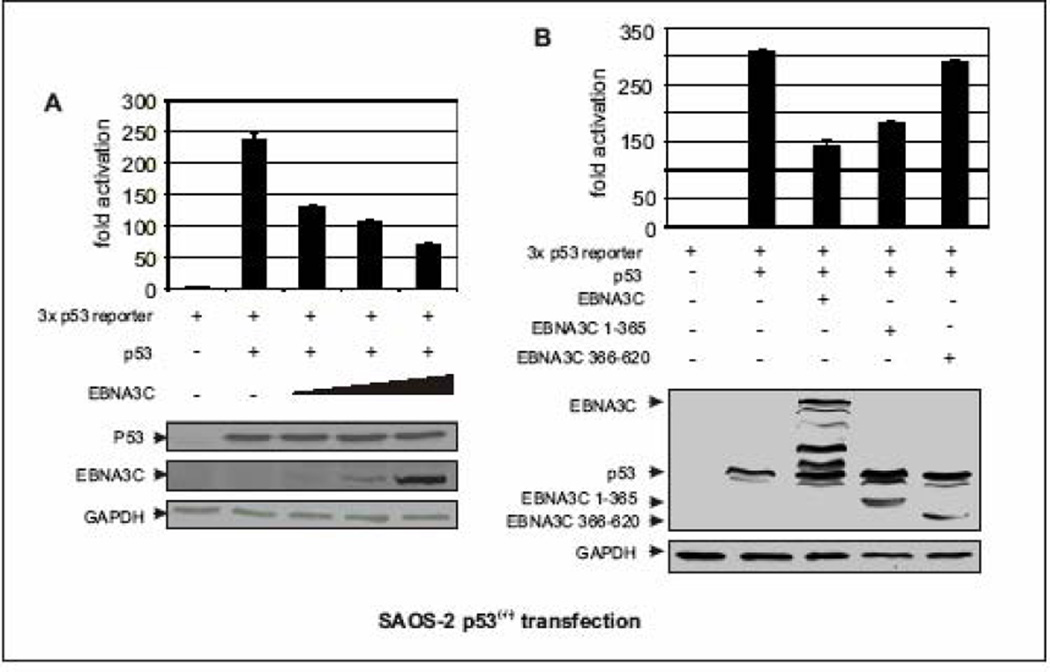
Figure 5.
EBNA3C represses p53 mediated transcriptional activity. (A–B) Approximately 0.4 × 10⁶ SAOS-2 (p53−/−) cells were cotransfected with 0.25 µg of the promoter construct containing p53 responsive element and 0.5 µg of myc-tagged p53 plus either vector control or A) increasing amount of flag-tagged EBNA3C expressing constructs (0, 0.25, 0.5, 1.0 µg respectively) B) flag-tagged different truncated mutants of EBNA3C using Lipofectamine 2000 (Invitrogen). At 24 h post-transfection, cells were harvested and lysed for luciferase assays. Total amount of proteins were normalized by Bradford assay. Increasing amounts of EBNA3C show proportional increment in luciferase activity. The representative plot is a mean of two independent experiments. Error bar represents standard deviation (SD). Bottoms panels indicate the fractions of the cell lysates were resolved by SDS-PAGE to demonstrate the expression levels of p53 and EBNA3C. GAPDH blot was done for loading control.

