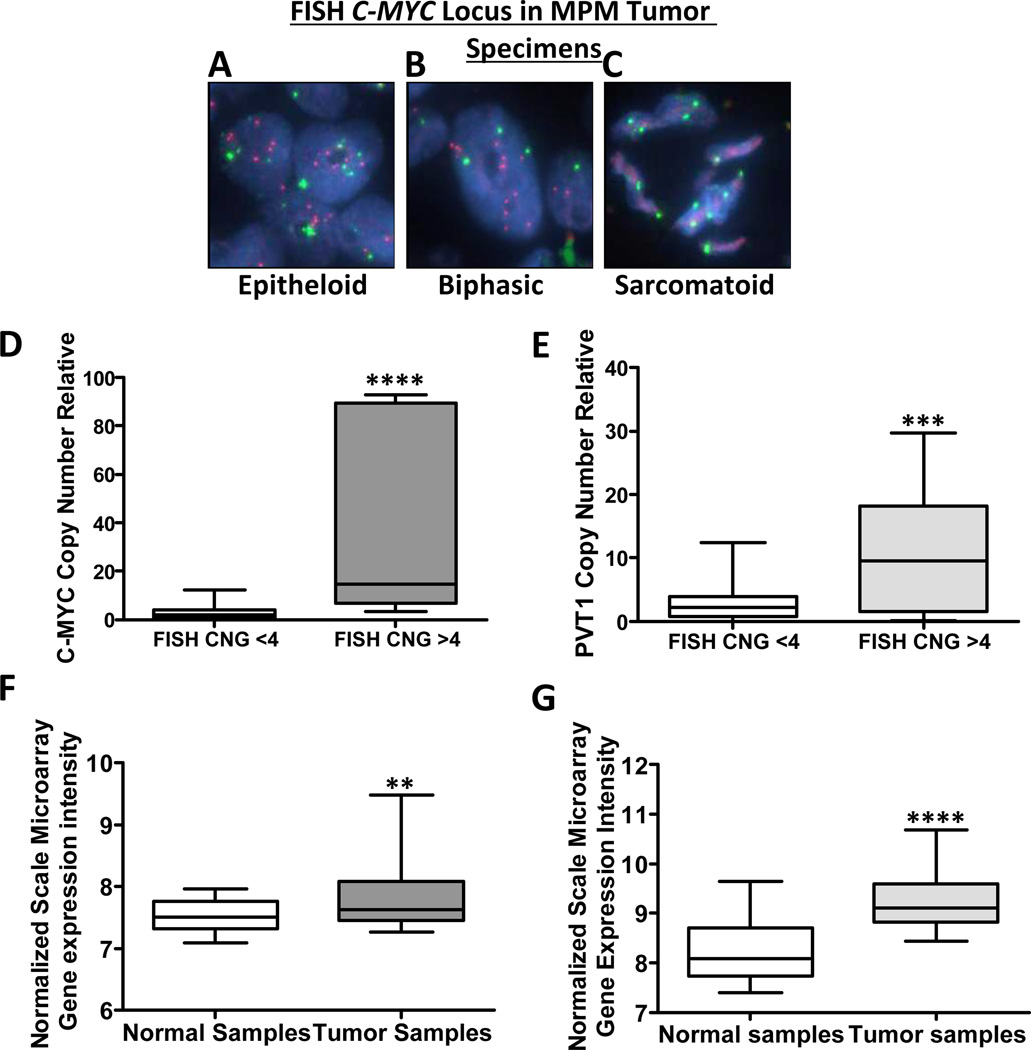
Figure 3.
Malignant plural mesothelioma (MPM) tumor tissue specimens show C-MYC and PVT1 locus–specific copy number gain (CNG) and high expression of C-MYC and PVT1. Representative examples of C-MYC CNG examined by Fluorescence in situ hybridization (FISH) in MPM tissue specimens show high frequency of CNGs. FISH analysis shows, A, CNGs in epithelioid MPM. B, CNGs in biphasic MPM. C, no CNG in sarcomatoid MPM. Red signals represent the C-MYC gene probe, whereas and green signals represent the internal control probe (magnification 1,000×). Real time quantitative PCR (q-PCR) analysis of CNG of C-MYC and PVT1 in MPM tumor specimens by compared with CNG by FISH shows a correlation between both approaches. D, The box plots depict relative CNG of C-MYC revealed by q-PCR in 11 MPM tumor cell lines with C-MYC CNG as established by FISH and 19 MPM tumor cell lines without C-MYC CNG as established by FISH. **** p < 0.0001. E, The box plots depict relative CNG of PVT1 by q-PCR in 11 MPM tumor cell lines with C-MYC CNG as established by FISH and 19 MPM tumor cell lines without C-MYC CNG as established by FISH. *** p < 0.001. Normalized mRNA expression analysis F, C-MYC and G, PVT1 transcript using Affymetrix U133 plus 2.0 chips in MPM tumor specimens compared with normal samples. **** p < 0.0001, ** p < 0.01.

