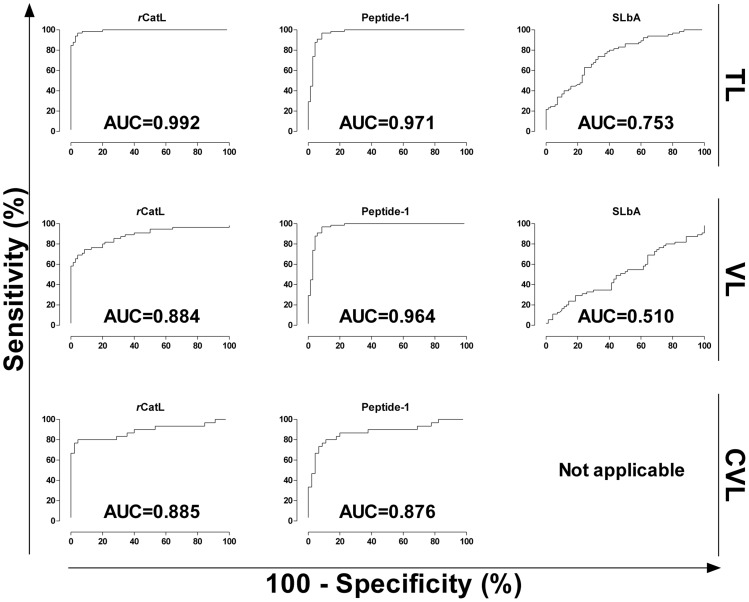
Figure 4. Comparison of ROC curves obtained from rCatL, Peptide-1 and SLbA.
The ROC curves were used to determine the ELISA cut-off, sensitivity, specificity and AUC. In case of SLbA for CVL diagnosis (EIE-LVC Kit), ROC curve is not shown (not applicable) in this graph because the cut-off was determined according to the recommendations by the manufacturer (twice the average of the negative control included in kit).

