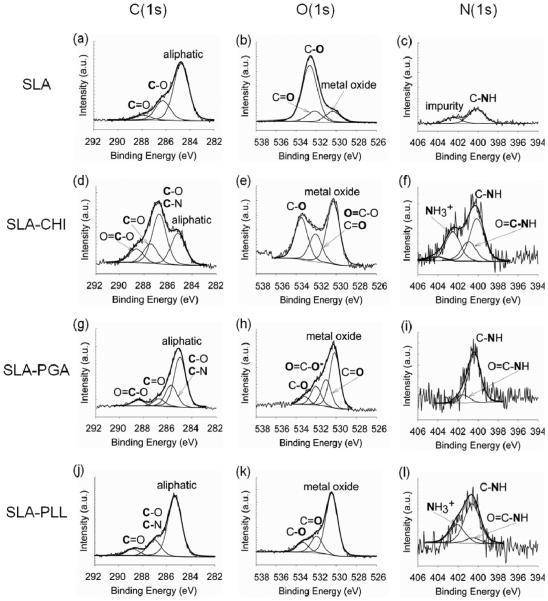
Figure 3.
High resolution X-ray photoelectron spectroscopy (XPS) spectra of SLA surfaces before and after polyelectrolyte coating: a, b, and c correspond to the C(1s), O(1s), and N(1s) core electrons of the control SLA, respectively; d, e, and f correspond to the C(1s), O(1s), and N(1s) core electrons of the SLA coated with chitosan (CHI), respectively; g, h, and i correspond to the C(1s), O(1s), and N(1s) core electrons of the SLA coated with poly(L-glutamic acid), respectively; and j, k, and l correspond to the C(1s), O(1s), and N(1s) core electrons of the SLA coated with poly(L-lysine), respectively.

