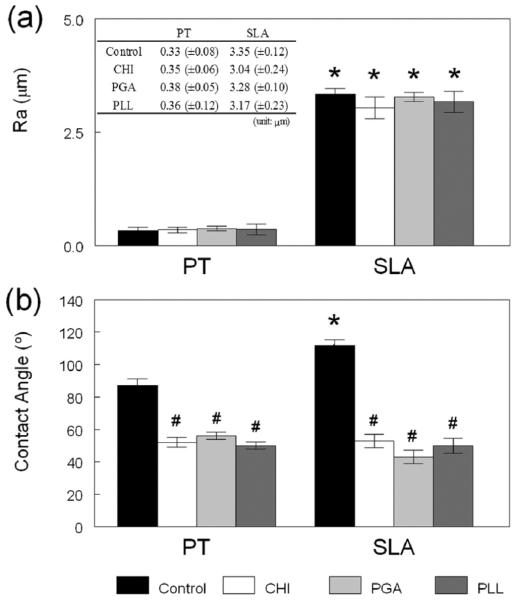
Figure 7.
Influence of the polyelectrolyte coating on (a) roughness and (b) contact angle on PT and SLA surfaces, respectively. *p < 0.05, PT vs SLA surface; #p < 0.05, polyelectrolyte coated surfaces vs control surface. The table in part a shows the actual surface roughness measurements and the associated experimental errors. The ~0.3 μm average surface roughness values of the PT and coated PT surfaces correspond to the images in Figure 4, and the ~3 μm average surface roughness values of the SLA and coated SLA surfaces correspond to the images in Figure 5.

