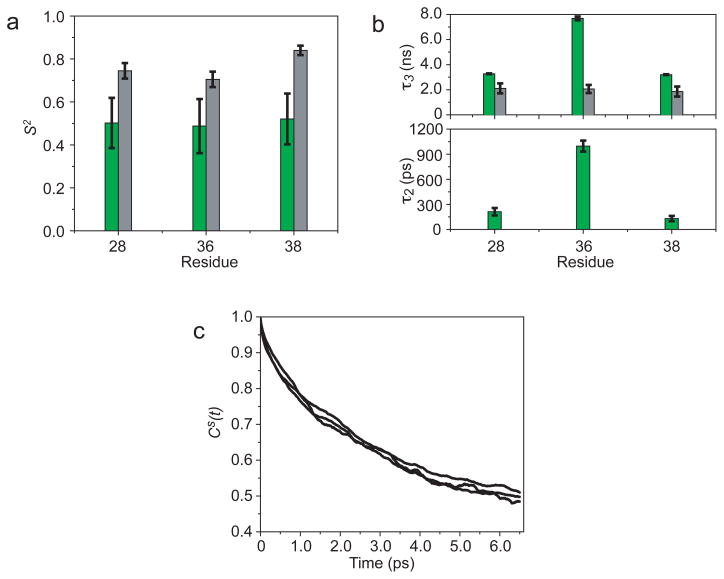
FIGURE 4.
(a) Order parameters, S2, as obtained from the tails of the “slow” Cs(t) correlation functions (green) compared to the “slow” S2 values obtained from experiment (gray) for three residues in domain II. (b) The second and third correlation times, τ2 and τ3 obtained from fitting the calculated correlation functions to a triple exponential function with τ3 compared to the experimental τ. (c) The corresponding Cs(t) correlation functions.

