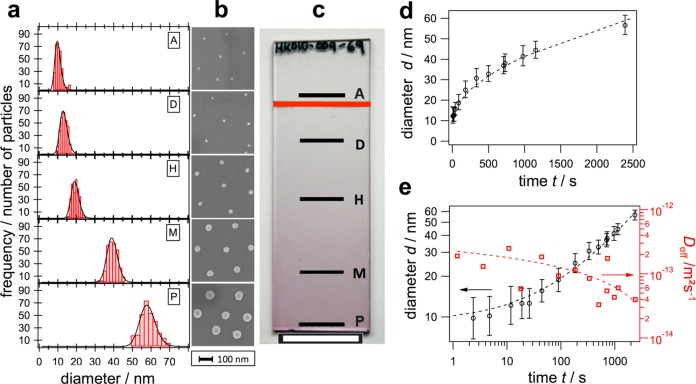
Figure 2.
Particle size investigation along the gradient: (a) Histograms of the particle size for five different positions on the substrate (details for all 16 spots can be found in Figure 5) with diameter increasing from top to bottom (positions A to P) and (b) corresponding SEM images. (c) Photograph illustrating the macroscopic appearance of the glass slide, where the color gradient is attributed to the increasing particle size from position A (smallest gold cores, not overgrown) to P (largest, overgrown gold cores). The black lines indicate the positions on the substrate. The red line marks the maximum immersion depth. The scale bar is 2 cm. (d) Growth kinetics evaluated by AFM. (e) Effective diffusion coefficient (Deff) evaluated by incremental regression of the change in size using eq 1. Dashed curves are guides to the eye.

