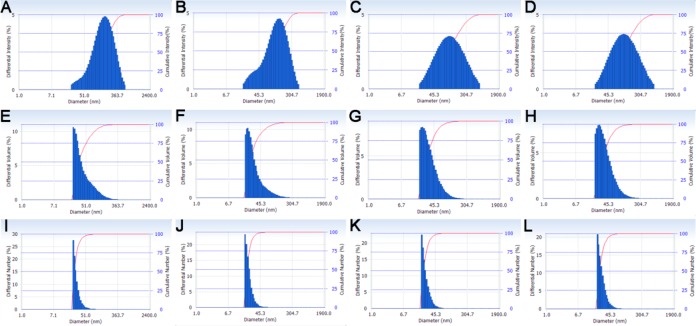
Figure 3.
Dynamic light scattering histograms (determinations were average values from 10 measurements, with the standard deviations being calculated as the breadth of the distributions). Top row: intensity average of (A) empty SCK, (B) AgNO3-SCK, (C) AgCOOCH3-SCK, and (D) SCC10-SCK. Middle row: volume average of (E) empty SCK, (F) AgNO3-SCK, (G) AgCOOCH3-SCK, and (H) SCC10-SCK. Bottom row: number-average of (I) empty SCK, (J) AgNO3-SCK, (K) AgCOOCH3-SCK, and (L) SCC10-SCK.

