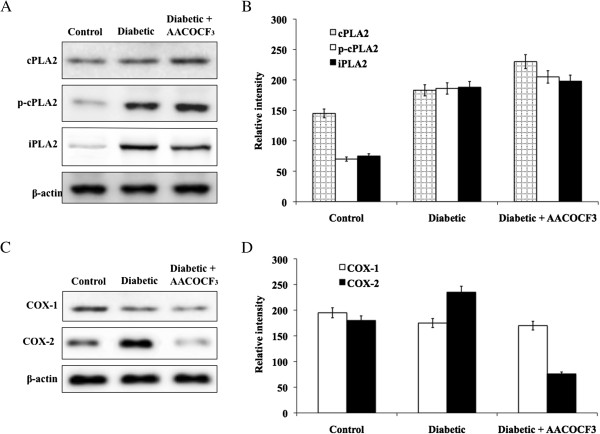
Figure 4.

Evaluation of PLA2 and COX proteins. A. Represent the protein expression of total protein cPLA2 and its phosphorylated form in control and diabetic retinopathy rats and B. Represent the quantification of corresponding band intensity using image-J analysis. C. Represent the protein expression of COX-1 and COX-2 in control and diabetic retinopathy rats. D. Represent the quantification of COX-1 and COX-2 band intensity using image-J analysis.
