Figure 5.

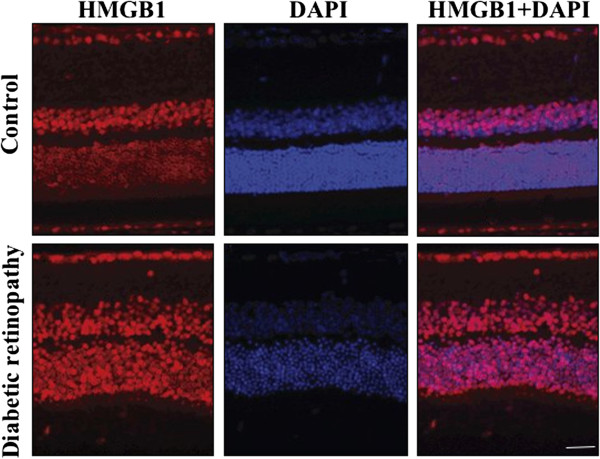
Represent the HMGB1 (red) and DAPI (blue) staining of retinal layer of control and STZ-induced diabetic retinopathy rats. The high expression of HMGB1 was noted in diabetic retinopathy. Scale bar = 50 μm.

Represent the HMGB1 (red) and DAPI (blue) staining of retinal layer of control and STZ-induced diabetic retinopathy rats. The high expression of HMGB1 was noted in diabetic retinopathy. Scale bar = 50 μm.