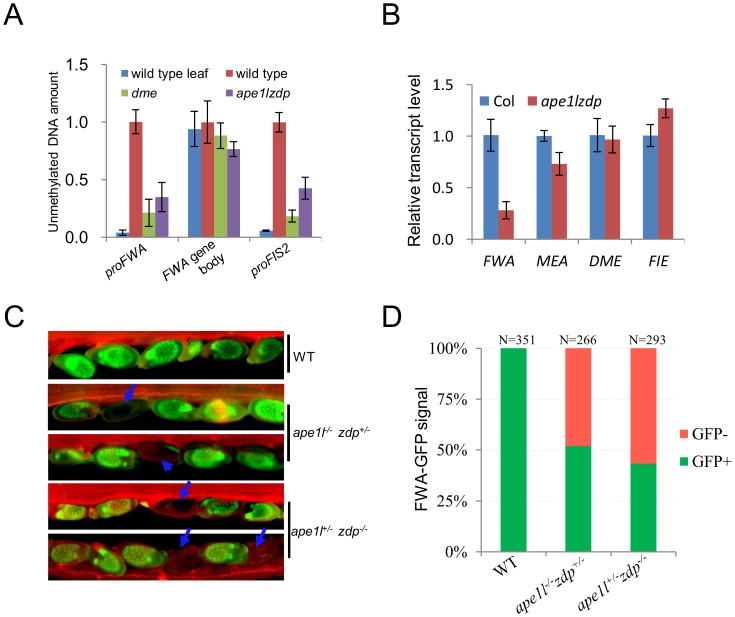
Figure 6. Methylation levels and expression of imprinted genes.
(A) Estimation of relative endosperm DNA methylation levels from wild type and ape1lzdp mutant in 3-days-after-pollination seeds. Equal amounts of seeds DNA were digested with McrBC, and undigested genomic DNA was used as a standard for absolute quantification of specific regions. The leaf sample was used as a control for the digest. Error bars represent standard error (n = 3) (B) qRT-PCR analysis of imprinted genes in wild type and mutant endosperm. The transcript levels were normalized against ACT11 expression. Error bars represent standard error (n = 3). (C) Fluorescence images of pFWA::ΔFWA-GFP in Col, ape1l+/−zdp−/− and ape1l−/−zdp+/− plants. Arrows indicate seeds with silenced FWA-GFP. Images were captured at 4 days after pollination. (D) GFP phenotype of Col, ape1l+/−zdp−/− and ape1l−/−zdp+/− plants at 4 DAP. N indicates the number of ovules examined.

