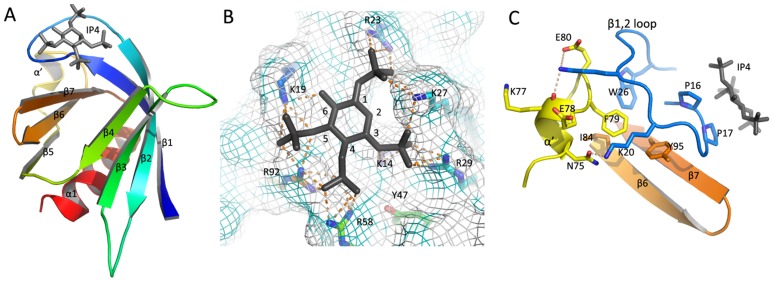
Figure 3. The 3D model of GAB1 PH domain.
A. The overall structure of IP4-bound GAB1 PH domain. The protein secondary structure is shown in ribbons and IP4 is shown in sticks. B. A close view of the IP4 binding site. The critical residues for IP4 binding are labeled, and IP4 is in black stick with position labeled. The hydrogen bonds are illustrated with dashes. C. Interactions between α′-helix and β5,6 loop. The residues mediating the interactions are highlighted with sticks and hydrogen bonds are illustrated with dashes.

