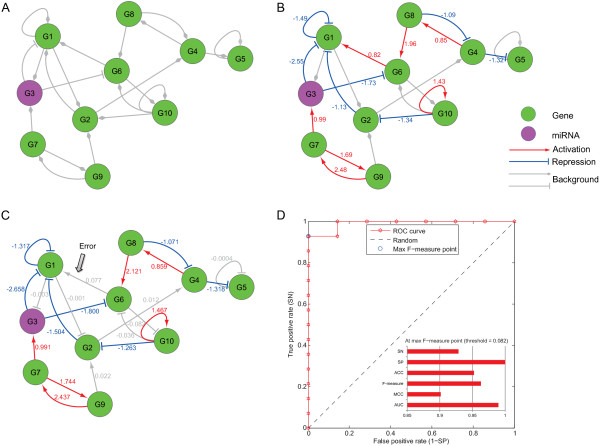
Figure 1.

Illustration of the performance evaluation of SITPR using an example regulatory network. (A) The background regulatory network with 10 nodes. 'G3’ denotes a miRNA and is labeled in magenta. (B) The activated regulatory relationships (edges in color). The numbers next to the edges are the regulatory strengths. (C) An example of the inferred activated regulatory network using SITPR. (D) The ROC curve and the six performance evaluations at the maximum F-measure point.
