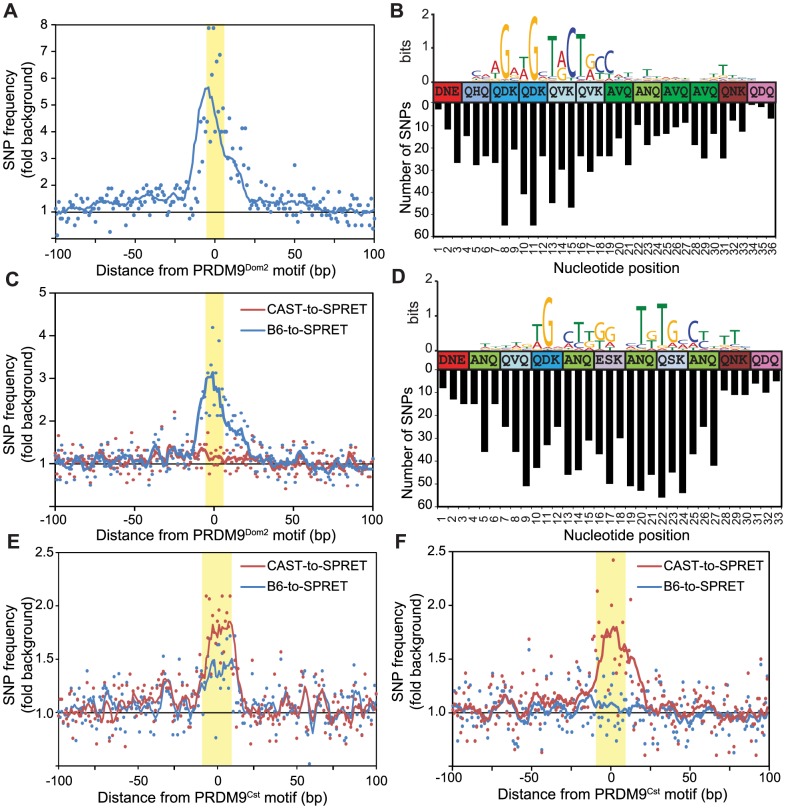
Figure 3. Novel hotspots are the sites of historic hotspot erosion.
(A) SNP frequency between B6 and CAST haplotypes for PRDM9Dom2-dependent novel hotspots with haplotype ratio <0.2 (n = 810, points - value at each nucleotide, line - 10 bp running average, highlight - PRDM9Dom2 motif). (B) Top – CAST haplotype-derived PRDM9Dom2 motif for hotspots in A. Middle – Amino acid sequence for PRDM9Dom2 zinc-finger array positions predicted to contact DNA. Bottom – Number of SNPs identified at each base pair position (background subtracted). (C) SNP frequency between B6 and SPRET (blue) or CAST and SPRET (red) for PRDM9Dom2 novel hotspots in A. (D) SNP frequency between B6 and CAST haplotypes at hotspots unique to the KI strain (n = 2,035, hotspot represented by black line in Fig. 1D). Top – PRDM9Cst motif derived from the B6 haplotype. Middle – Amino acid sequence for PRDM9Cst zinc-finger array. Bottom – Number of SNPs identified at each base pair position (background subtracted). (E) Similar to C except comparing SNP frequency between B6 and SPRET (blue) or CAST and SPRET (red) for hotspots used in D. (F) Similar to E for PRDM9Cst hotspots quantitatively higher in the KI strain compared to CAST (hotspots from Fig. 1D green line, n = 2,187).

