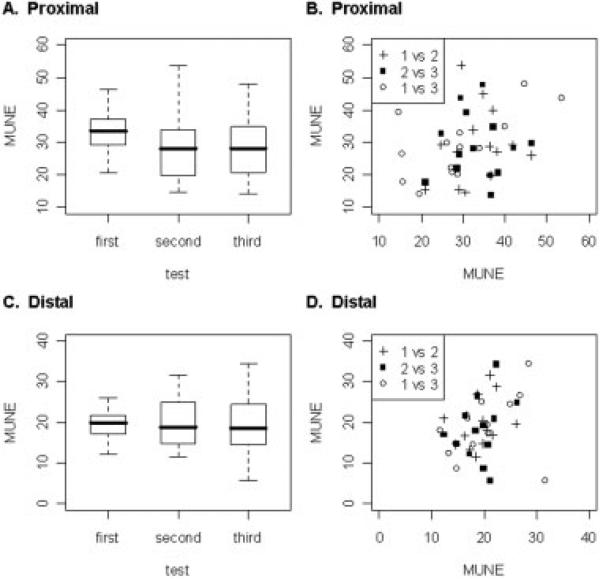
FIGURE 2.
Boxplots of the proximal and distal tail MUNE results for the same rater and scatterplots of the associated intrarater reliability in proximal and distal tail. (A) There were no significant differences in proximal tail MUNE for the same rater among any tests. (B) The intrarater correlation coefficient for proximal tail MUNE was r = 0.31, P = 0.033 (1 vs 2 = first versus second test, 2 vs 3 = second versus third test, and 1 vs 3 = first versus third test). (C) There were no significant differences in distal tail MUNE for the same rater among any tests. (D) The intrarater correlation coefficient for distal tail MUNE was r = 0.32, P = 0.028 (1 vs 2 = first versus second test, 2 vs 3 = second versus third test, and 1 vs 3 = first versus third test).

