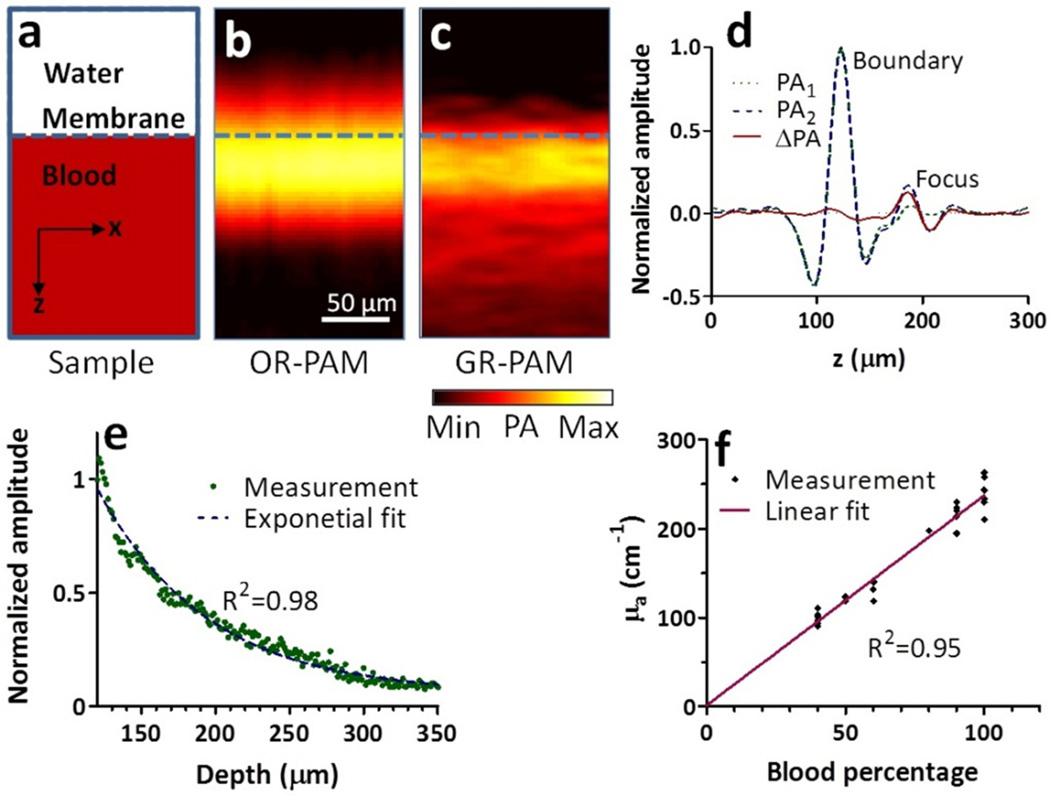
Fig. 4.
(a) Diagram of a thick blood sample. (b) An OR-PAM cross-sectional image. (c) A GR-PAM cross-sectional image. (d) Time-resolved PA signals from the two laser pulses and the differential PA signal. The focus was 60 µm below the blood surface. (e) Exponential decay of GR-PAM amplitude along depth. (f) Measured absolute absorption coefficient versus set absorption coefficient.

