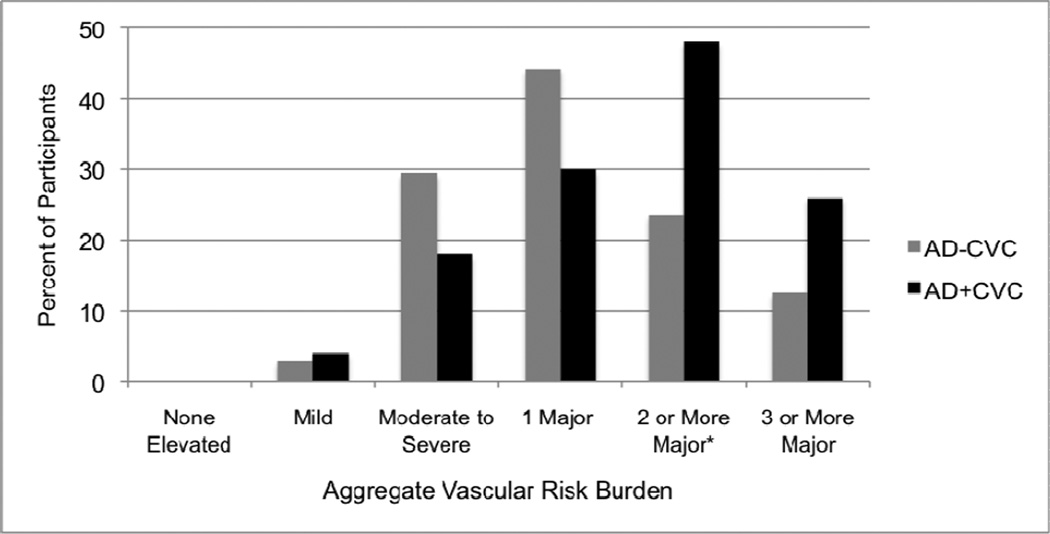
Figure 1. Aggregate vascular risk burden for Alzheimer’s disease groups with cerebrovascular changes (AD+CVC) and without cerebrovascular changes (AD−CVC).
Bar graph showing the percent of participants in the AD-CVC and AD+CVC groups classified into each of six categories: (1) no elevated risk factor levels (0% of participants fit this category), (2) ≥1 mildly elevated risk factor, (3) ≥1 moderately-to-severely elevated risk factor(s), (4) 1 major risk factor only, (5) ≥2 major risk factors, and (6) ≥3 major risk factors.
* χ2 = 5.14 (p = .02) for comparison between AD-CVC and AD+CVC

