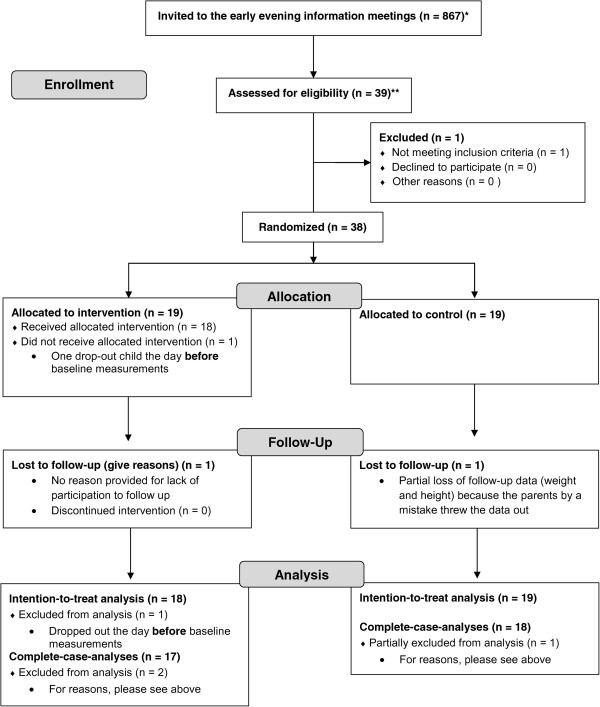
Figure 1.

Design of the randomized controlled trial. CONSORT 2010 Flow Diagram [34] showing the number of children invited, enrolled, allocated, at Follow-Up, and in the analyses. *Children (age 7–10 years) at inclusion time in Høje Taastrup Municipality who were identified as overweight or obese by the ‘SundSkoleNettet’/‘The Healthy Schools Network’. **Children (age 7–10 years) at inclusion time who participated in the early evening information meetings.
