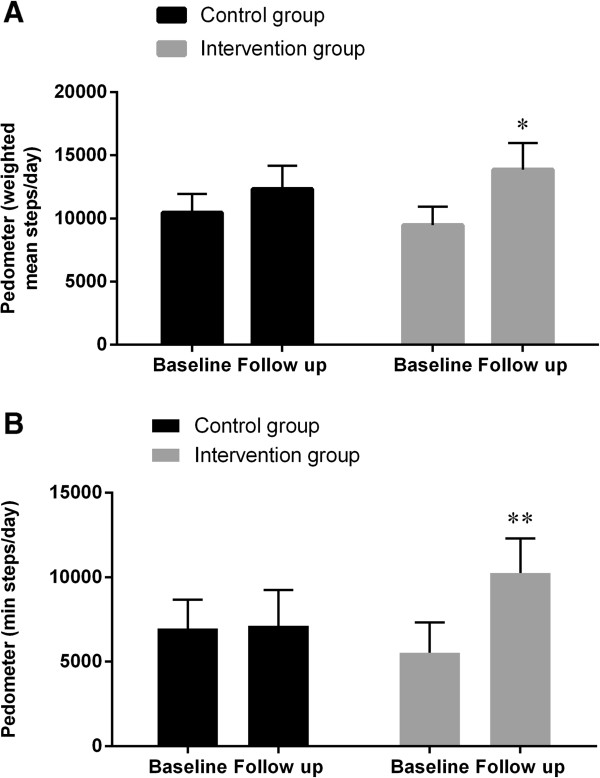
Figure 3.

Physical activity measured by pedometer. Weighted mean steps per day (A) and mean minimum steps registered on the least active single day (B) registered by Pedometer. P values are representing the intervention effects (the difference in change between the groups) adjusted for the respective baseline values (95% Confidence intervals as error bars). ★, P <0.05; ★★, P <0.01.
