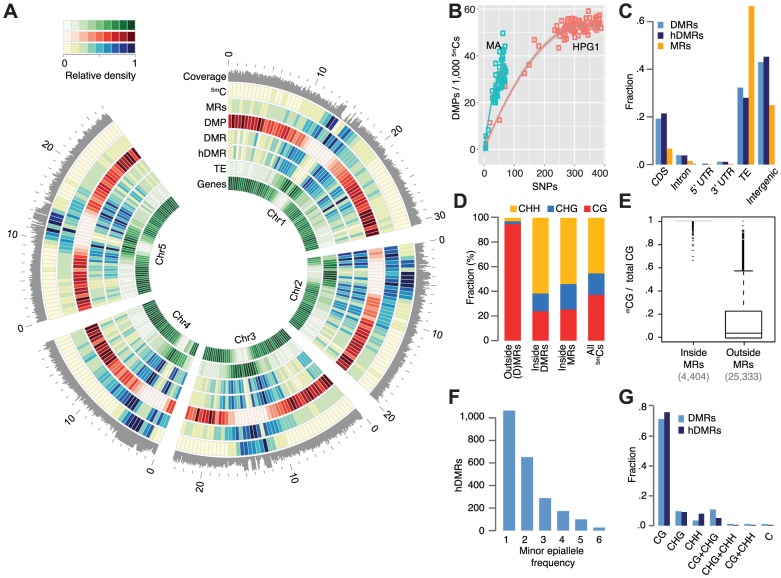
Figure 2. Epigenetic variation in a nearly isogenic population.
(A) Genome-wide features: average coverage in 100 kb windows, the remainder in 500 kb windows. Outside coordinates in Mb. (B) Number of DMPs in relation to number of SNPs in pairwise comparisons. Data of mutation accumulation (MA) lines are based on single individuals, haplogroup1 (HPG1) data on pools of 8–10 individuals; each data point represents an independent comparison of two lines. DMPs in each pairwise contrast were scaled to the number of methylated sites compared. (C) Annotation of cytosines in MRs and hDMRs. (hD)MR sequences were assigned to only one annotation in the following order: CDS> intron. UTR> transposon> intergenic. (D) Sequence context of methylated positions relative to MRs and DMRs. (E) Fraction of 5mCGs among all CG sites for each gene and transposable element, with at least 5 CGs. (F) Minor epiallele frequencies of 2,304 hDMRs that could be split into only two groups and for which at least four strains showed statistically significant differential methylation. Strains not tested statistically significant for a particular hDMR were not considered for this plot. (G) DMRs and hDMRs according to sequence contexts in which significant methylation differences were found. ‘C’ denotes (h)DMRs in all three contexts. Abbreviations: 5mC: methylated position, CDS: coding sequence, DMP: differentially methylated position, DMR: differentially methylated region, hDMR: highly differentially methylated region, HPG1: haplogroup-1 lines, MA: mutation accumulation lines, MRs: methylated regions, SNP: single nucleotide polymorphism, TE: transposable element, UTR: untranslated region.

