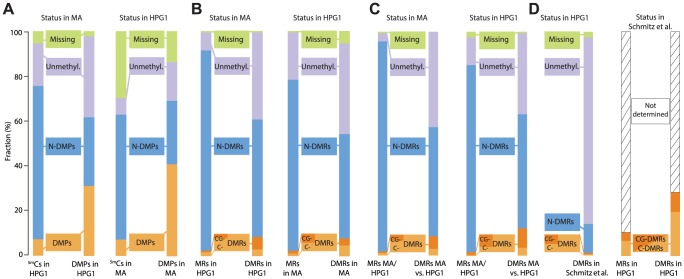
Figure 3. Overlapping epigenetic variation in independent populations.
(A) Comparison of methylated positions (5mCs) and differentially methylated positions (DMPs) identified in pairwise comparisons of mutation accumulation (MA) [12] and haplogroup-1 (HPG1). Distinction in different sequence contexts has been omitted since almost all DMPs (>97%) are in CG context. Left: sites in HPG1 strains and their status in the MA data; right: sites in the MA strains and their status in the HPG1 data. N-DMPs: non-differentially methylated positions. (B) Comparison of methylated regions (MRs) and differentially methylated regions (DMRs) identified in pairwise comparisons of HPG1 and MA lines. Dark and light orange subsets of DMRs distinguish regions with differential methylation occurring exclusively in CG context (CG-DMRs) or in any additional or alternative context(s) (C-DMRs). Left: regions in HPG1 strains and their status in the MA data; right: regions in the MA strains and their status in the HPG1 data. (C) MRs and DMRs identified in comparison between one randomly chosen MA line (30–39) and one randomly chosen HPG1 line (MuskSP-68), and their overlap with within-population DMRs. (D) Comparison of HPG1 DMRs with CG-DMRs (dark orange) from ref [10] and C-DMRs (light orange) identified in 140 natural A. thaliana accessions. Because methylated regions were not reported in ref. [10], the overlap of DMRs with the space not covered by DMRs could not be assessed. N-DMRs: non-differentially methylated regions.

