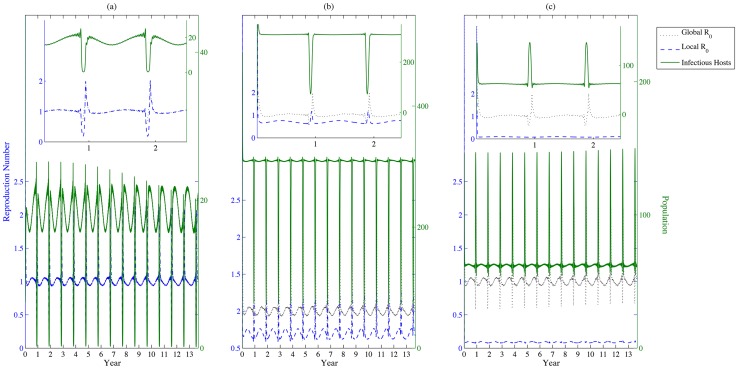
Figure 5. Basic reproduction number.
(a), (b) and (c) represent the populations of infectious livestock (solid line), the instantaneously local basic reproduction number (dashed line) and the instantaneously global basic reproduction number (dotted line) in patches 1, 2 and 3, respectively. Values of other parameters are identical with those in Fig. 3. The instantaneously global basic reproduction number is computed by considering the three patches as an entirety, while the instantaneously local basic reproduction number is measured only within the local patch based on the current disease dynamics.

