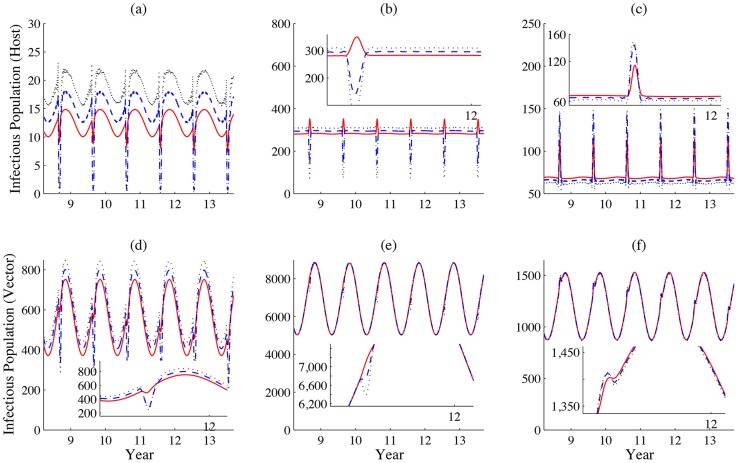
Figure 7. How daily increment in movement speeds impacts patterns of disease outbreaks.
(a)-(c) show the populations of infectious livestock and (d)-(f) simulate the populations of infectious vectors in patches 1, 2 and 3, respectively. The daily increment of movement speeds are 10, 54 and 98 km/per day, represented by solid, dashed and dotted lines, respectively. Values of other parameters are identical with those used in Fig. 3. During the festival season, infectious livestock are transported from patch 1 to patch 3, via patch 2, therefore we can observe that the population of infectious livestock has a sudden drop in patches 1 and 2 while an increase in patch 3 in the case that movement speed is relative fast (the increment  ).
).

