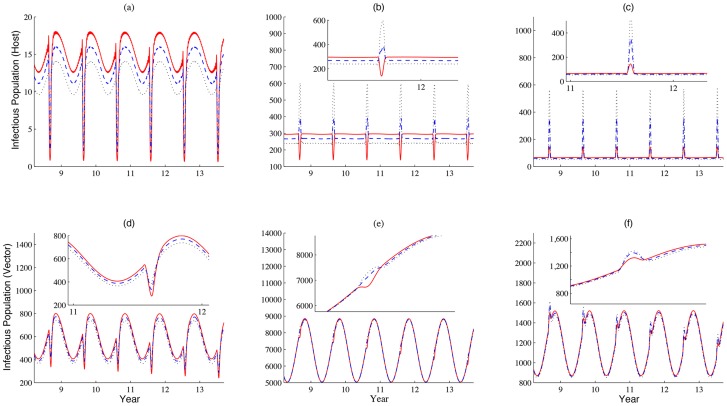
Figure 9. How daily increment in the daily imported number of livestock impacts patterns of disease outbreaks.
(a)-(c) and (d)-(f) show the populations of infectious livestock and vectors in patches 1–3, respectively. The increment  on the daily imported number in patch 1 are 20, 100 and180 per day, represented by solid, dashed and dotted lines, respectively. Values of other parameters are identical with those used in Fig. 3 and
  (km per day).

