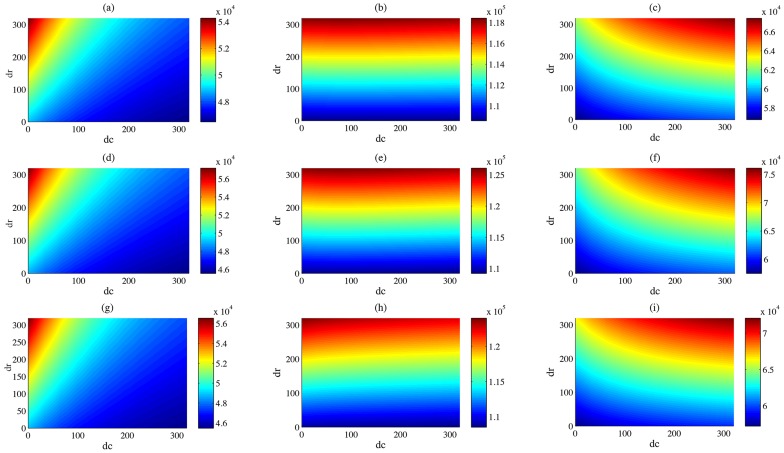
Figure 10. Interaction between the daily increment in movement speeds and the daily imported number on the size of cumulative infected livestock population.
(a)-(i), simulations of the cumulative numbers of infected livestock at year 4, 29, and 62 (by row) in patches 1, 2, and 3 (by column). Same values of parameters used in Fig. 3.

