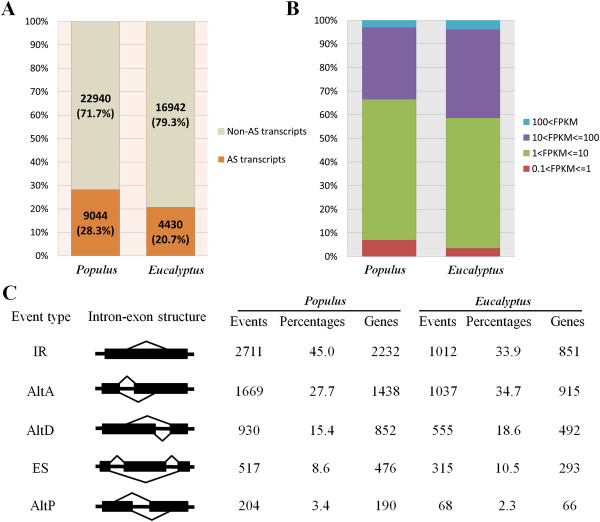
Figure 1.

AS profiles in developing xylem of Populus and Eucalyptus . (A) Percentages of expressed transcripts undergoing AS in two species. (B) Expression levels of AS transcript isoforms. The expression abundance was measured with unit of FPKM (Fragments Per Kilobase of transcript per Million mapped reads). (C) Distribution of different AS types. IR, intron retention; AltA, alternative acceptor site; AltD, alternative donor site; ES, exon skipping; AltP, alternative position.
