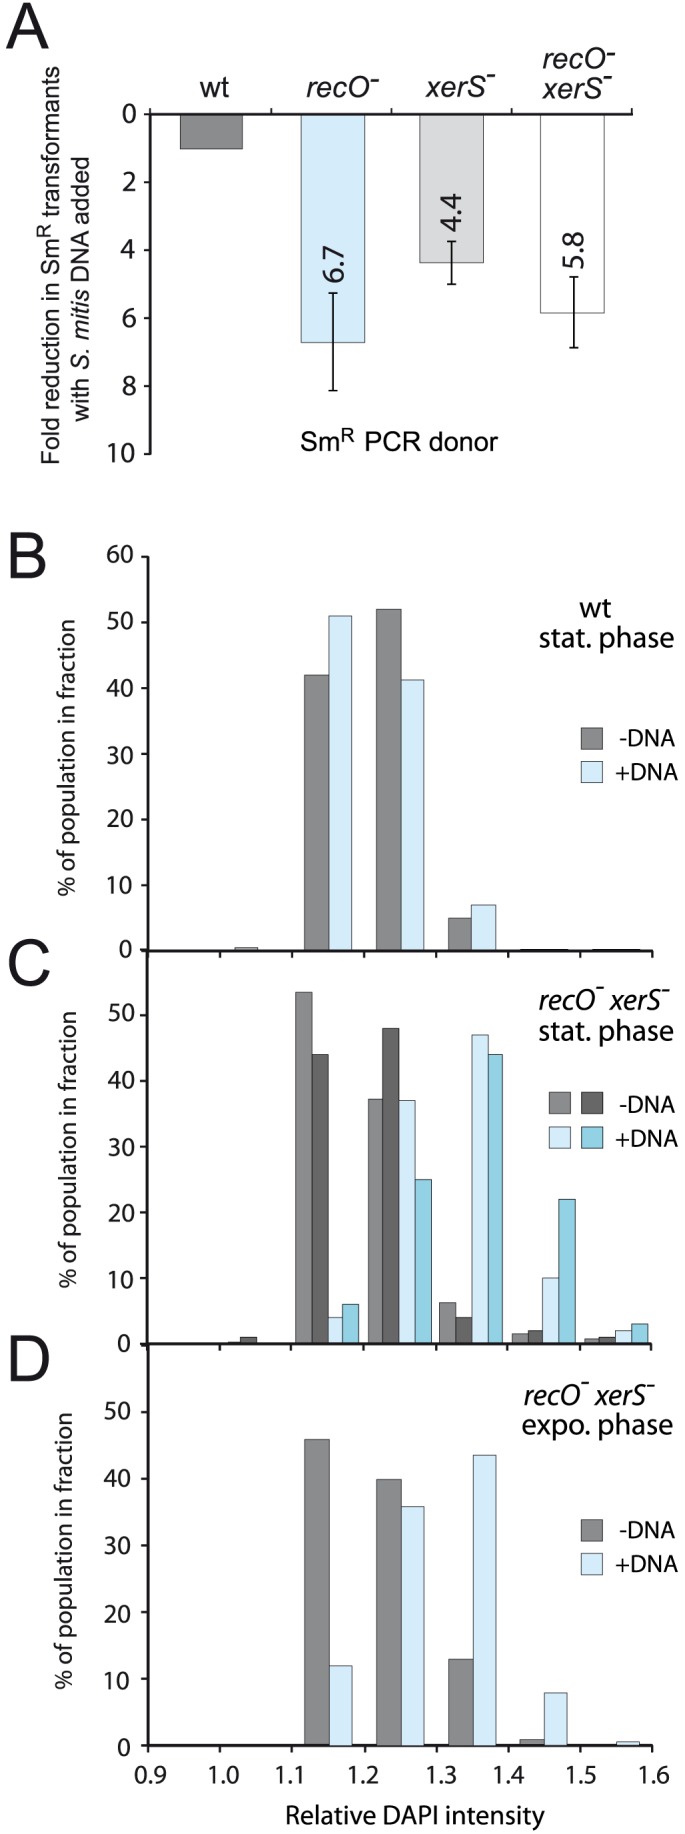
Figure 5. High frequency formation of chromosome dimers upon transformation with S. mitis chromosomal DNA.

(A) S. mitis DNA impacts transformation frequency of recO, xerS and recO xerS mutant cells. Comparison of transformation efficiency using as donor a mixture of PCR fragment carrying the rpsL41 mutation (SmR) and S. mitis chromosomal DNA. As a slight competition for uptake is observed between the PCR fragment and S. mitis chromosomal DNA in wildtype cells (reducing efficiency compared to PCR fragment alone by 1.6-fold), we adjusted fold reduction in wildtype to 1 and normalized to this same factor in all mutant cells. PCR concentration: 1.5 ng mL−1; chromosomal DNA concentration: 1 µg mL−1. Strains used: wildtype; R246, recO-; R3170, xerS-; R3214, recO- xerS-; R3873. (B) Monitoring ploidy through DAPI staining in cells transformed with S. mitis chromosomal DNA and grown to stationary phase (blue bars), compared to non-transformed competent cells (grey bars). Samples were taken at 160 min (see Fig. 4B). No difference in DAPI fluorescence intensity profile was observed in wildtype cells. Relative fluorescence intensity calculated by dividing total cell intensity by cell area. Results shown are representative of three individual experiments. Strain used: wildtype, R246. (C) Monitoring ploidy through DAPI staining in recO- xerS- cells transformed with S. mitis chromosomal DNA and grown to stationary phase. Two individual sets of data showing with non-transformed cells (light and dark grey) and transformed cells (two shades of blue). A shift in intensity profile towards greater fluorescence was observed with cells transformed with S. mitis DNA (compare blue and grey bars). Sampling and analysis as in panel B. Strain used: recO- xerS-, R3873. (D) Monitoring ploidy through DAPI staining in recO- xerS- cells transformed with S. mitis chromosomal DNA and maintained in exponential growth (blue bars), compared to non-transformed competent cells (grey bars). Samples were taken at 80 min (see Fig. 4D). A shift in intensity profile towards greater fluorescence was observed with cells transformed with S. mitis DNA (compare blue and grey bars). Same calculations and strain as in panel C.
