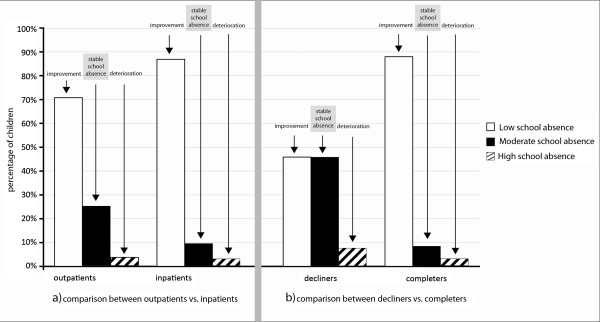
Figure 3.

Comparison between outpatients vs. inpatients and between decliners vs. completers regarding improvements, stable or deterioration in school absence for the group of children with initially moderate school absence. The figure shows changes in school absence for children with initially moderate school absence (i.e., 2 to 5 days within four school weeks). The left part of the figure (a) shows the comparison between outpatients vs. inpatients. The right part (b) shows the comparison between decliners vs. completers. Children were assigned to the ‘Improvement-group’ if they reported low school absence (<2 days/week) at the return visit. ‘Stable school absence’ represents children who still reported moderate school absence (2 to 5 days/week) at the return-visit and ‘deterioration’ represents children who reported high school absence (>5 days/week) at the return-visit.
