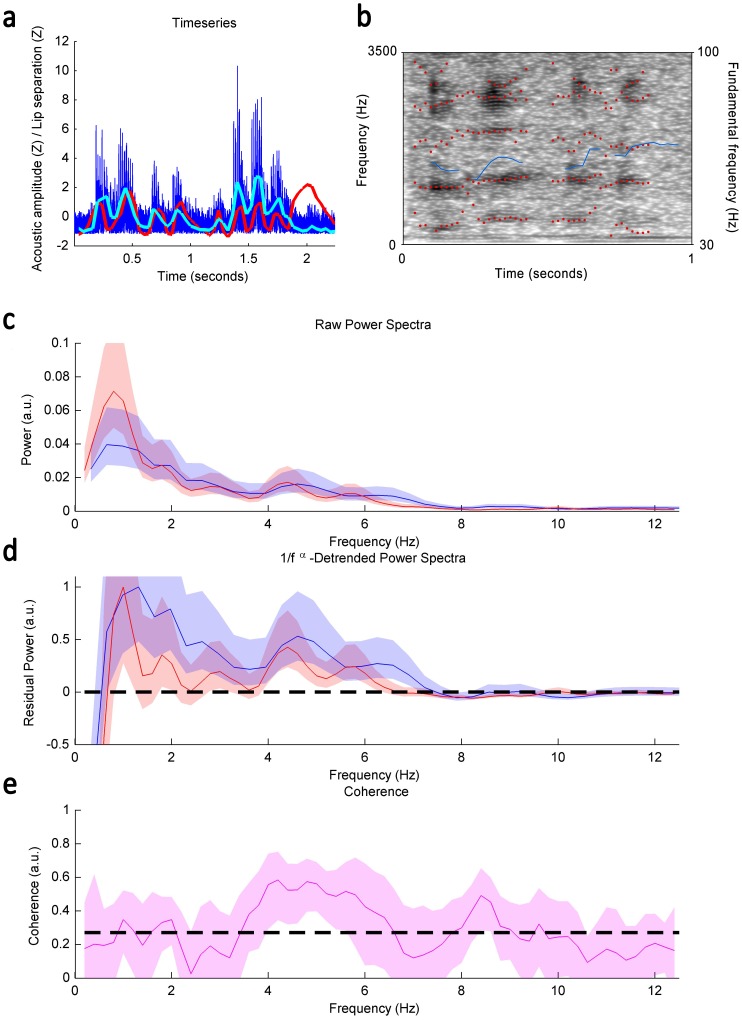
Figure 2. Descriptive analyses of orangutan faux-speech; a) Time series of an orangutan faux-speech bout.
Dark blue line indicates raw power spectra (dB), light blue line indicates acoustic amplitude envelop measure, and red line indicates inter-lip distance measure. b) Spectrographic representation of faux speech. Red dots indicate formats and blue line indicates fundamental frequency measure. c) Average estimates of raw power spectra; d) Detrended power spectra; e) Coherence of orangutan faux-speech.

