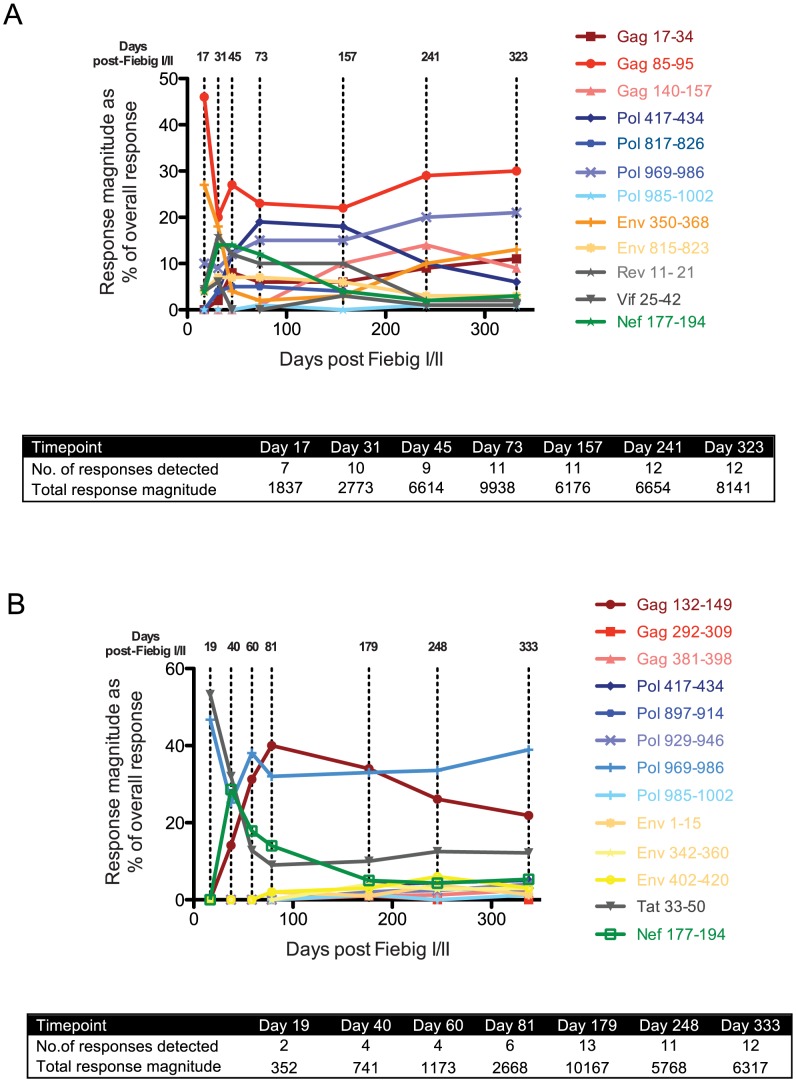
Figure 3. T cell response kinetics during acute and early HIV-1 infection.
For both R880F (A) and R463F(B), individual peptide response magnitudes in an IFNγ ELISpot assay are shown as a percentage of the overall response. The insert shows the number of peptide responses detected and the total response magnitude (SFC/106 PBMCs) at each of the time points tested. The sequences of the peptides are shown in Table 2.

