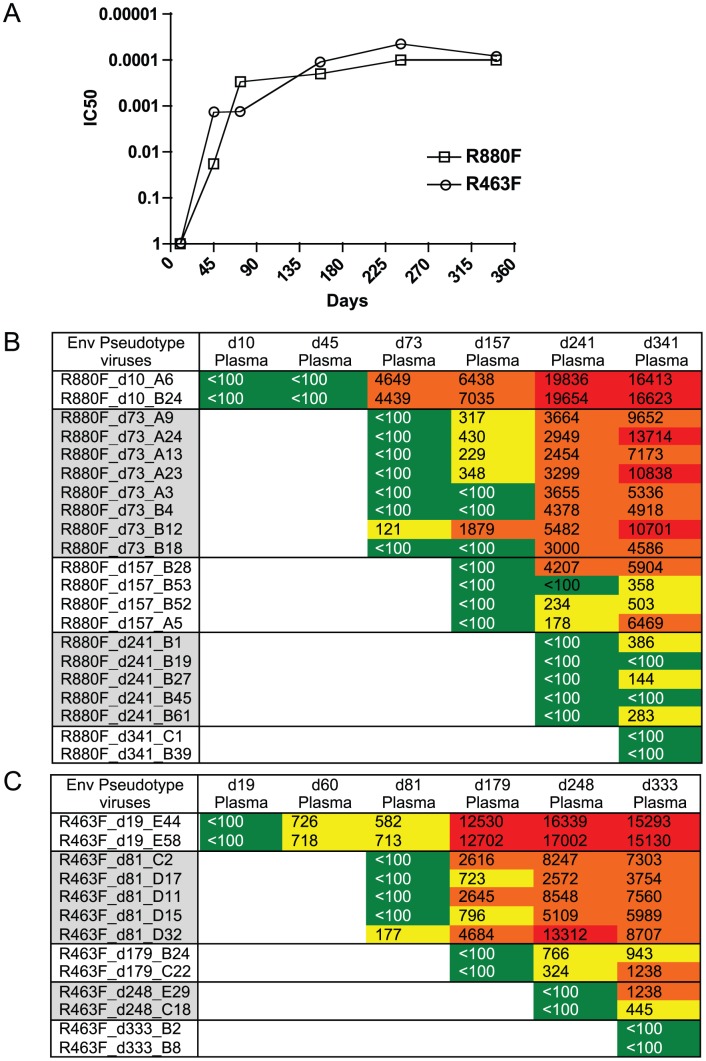
Figure 4. Longitudinal autologous neutralizing antibody IC50 titer during the first year of infection.
(A). The IC50 neutralizing titer (plasma dilution) against the T/F virus Env-pseudotyped HIV-1 derived from either R463F or R880F is plotted on the vertical axis on a log scale. R463F is depicted by open triangles; R880F is depicted by open squares. These experiments were replicated independently at least 3 times. (B). Heat map showing autologous neutralizing Ab activity versus Envs sampled during the first year of infection. Upper Panel R880F, Lower Panel R463F. Plasma sample dates (post-Fiebig I/II) are shown across the top, and Env clones used as pseudotypes from each time point are shown on the left. Green indicates IC50 Ab titers less than 1∶100; yellow indicates IC50s between 1∶100–1∶1000; orange indicates IC50s between 1∶1000–1∶10,000; red indicates IC50s>1∶10,000.

