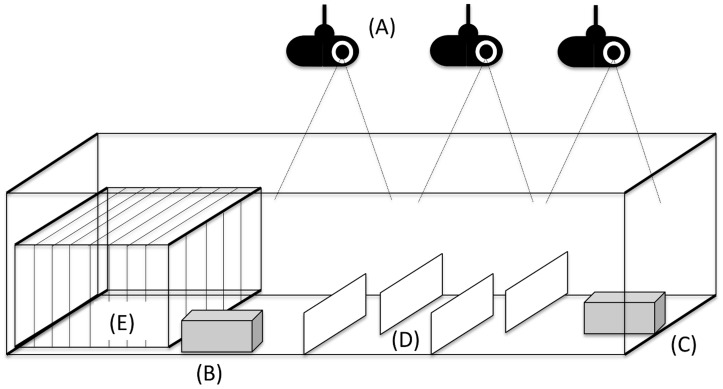
Figure 1. Diagram (not to scale) of experimental design for each glass tank.
Video cameras recording each area of the tank (A); primary (B) and secondary (C) refuges; glass-walled maze (D); and guinea pig cage (E). Green dots represent triatomine insects in the primary refuge (R1); red dots represent triatomine insects in the secondary refuge (R2); black dots represent triatomine insects in or under the guinea pig cage (Q1); and grey dots represent no triatomine insects. Q2, Q3, and Q4 stand for quadrants 2, 3, and 4.

