Figure 4.

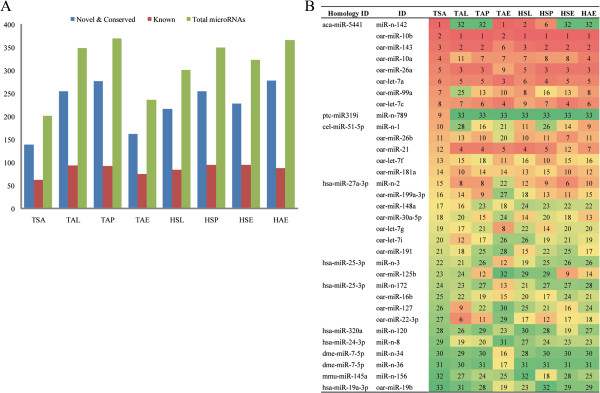
Comparison of the miRNA expression profiles between anestrus and the other three stages. (A) Expressed miRNAs for each sample; (B) The top expressed miRNAs in each sample.

Comparison of the miRNA expression profiles between anestrus and the other three stages. (A) Expressed miRNAs for each sample; (B) The top expressed miRNAs in each sample.