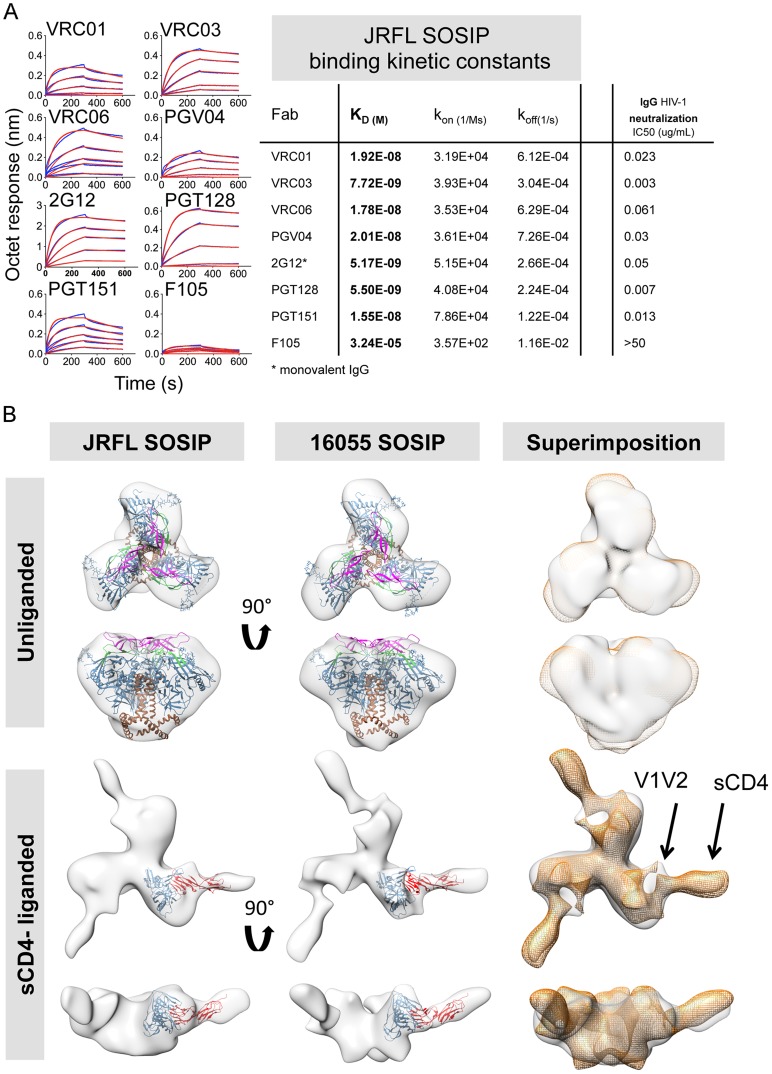
Figure 5. Kinetic measurements and EM 3D reconstructions of unliganded and sCD4-liganded SOSIP trimers.
(A) Binding kinetic measurements were determined for a selected panel of antibodies. Corresponding Fabs were used as analytes in solution in a concentration series (400 nM to 25 nM) while the negatively selected JRFL SOSIP trimers were immobilized on anti-His biosensor tips. JRFL HIV-1 neutralization IC50 values of the corresponding IgGs are shown to the left of the JRFL SOSIP binding kinetic constants. (B) Top panels display top and side views of the 3D reconstruction EM densities of unliganded JRFL and 16055 SOSIP trimers in gray with the BG505 SOSIP.664 EM structure (PDB ID 3J5M, gp120 in blue, V1V2 in magenta, V3 in green and gp41 in brown) fitted within. Bottom panel displays top and side views of the four-domain soluble CD4-liganded SOSIP trimers with the sCD4-bound gp120 core crystal structure (PDB ID 1GC1, gp120 in blue and sCD4 in red) fitted in the EM density. To the right, top and side views of the 16055 SOSIP EM density (orange) superimposed over the JRFL SOSIP EM density (in gray). The 2D class averages and Fourier Shell Correlation (FSC) are included in the supporting information.

