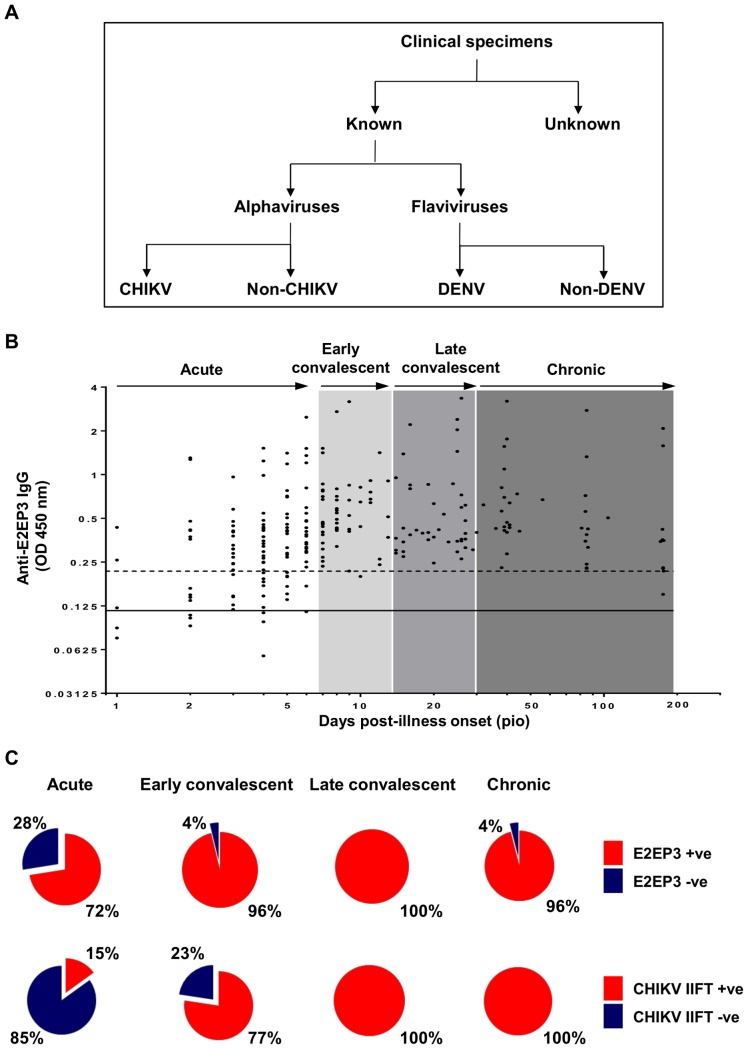
Figure 1. Antibody profiles of CHIKV-infected patients.
A, Schematic diagram on the classification of clinical specimens. Four hundred and ten clinical specimens were included in this study, 339 samples have validated by in-house screening methods including 60 flaviviruses-positive samples and 279 alphaviruses-positive samples. Validated samples were further sub-categorized into 4 groups: CHIKV; Non-CHIKV (positive for alphavirus); DENV; and non-DENV (flavivirus-positive). Another 71 samples of febrile patients with unknown cause of infection were also included in this study. B, CHIKV E2EP3-specific IgG antibody detection in patients' serum samples (total 38 patients, n = 260) at a dilution of 1∶4000 were determined by peptide-based ELISA. Black solid line represents the mean value of the healthy donors and dotted line represents the value of mean ±3 SD. Values above mean ±3 SD are considered positive anti-E2EP3 IgG antibody response. Data are presented as mean. Patient samples were categorized into different phase including acute (1–6 days); early convalescent (7–13 days); late convalescent (14–29 days); chronic (30–176 days). C, Pie-chart shows the percentage of patients with positive or negative anti-E2EP3 IgG antibody response (upper panel), and the percentage of patients with positive or negative anti-CHIKV IgG response using immunofluorescence-based biochips (CHIKV IIFT, EUROIMMUN AG) (lower panel).

