
Figure 6.
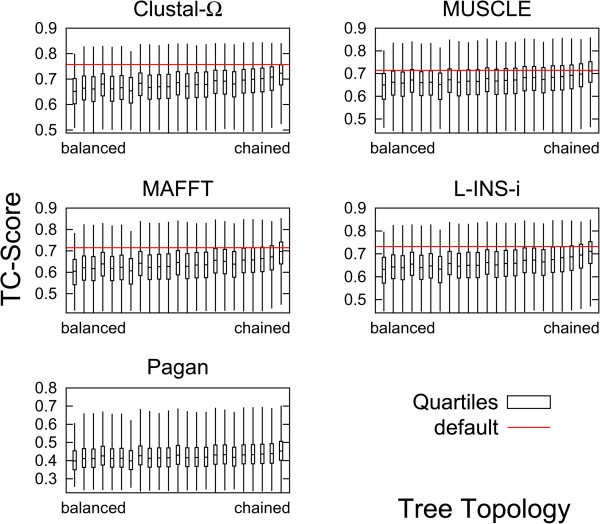
Quartiles of TC scores for different tree topologies. Tree topology along the x-axis, left-most box for perfectly balanced tree, right-most box for perfectly chained tree, intermediate topologies as specified in Additional file 1: Supplement S6. Whiskers represent top/bottom 25% scores, band represents median score. Boxes are averages over all 153 protein families. Red horizontal line shows average default score.