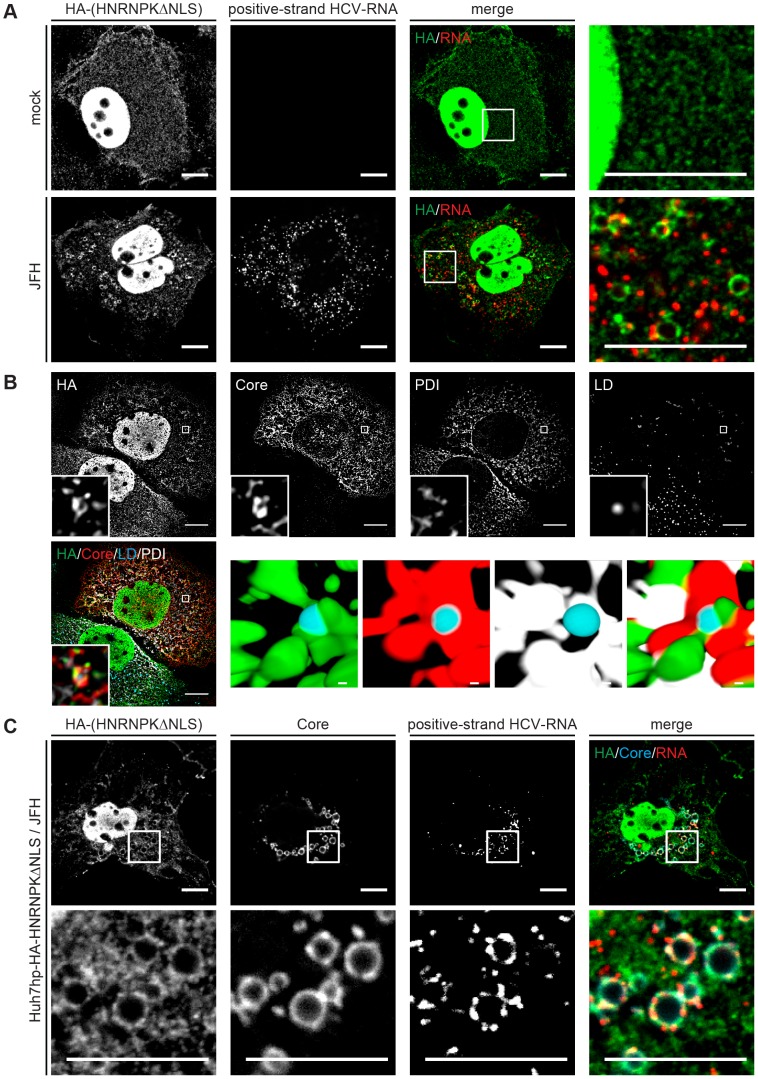
Figure 7. Redistribution of HNRNPK subcellular localization in HCV-containing cells and colocalization with viral RNA and core.
(A) Subcellular localization of HNRNPK is altered during HCV infection. Huh7hp cells stably expressing the HA-tagged HNRNPKΔNLS mutant were electroporated with genomic JFH1 (HCV) RNA or mock-transfected and fixed 72 h later. Ha-tagged HNRNPKΔNLS was visualized by immunofluorescence staining using a HA-specific antibody whereas HCV positive-strand RNA was detected by FISH using the QuantiGene ViewRNA ISH Cell Assay (Affymetrix). Enlargements of the sections indicated by white squares in the merged images are shown in the corresponding right panels. Note the pronounced punctuated staining pattern in the HCV-containing cell. (B) Ha-tagged HNRNPKΔNLS and core were visualized as described above and ER and LDs were detected by using PDI-specific antibody and HCS LipidTOX Deep Red, respectively. The small inserts in the bottom of each panel represent 3D reconstructed enlargements of each corresponding image created with the Imaris 7.7.2 software package. Scale bars represent 10 µm or 1 µm in regular and magnified images, respectively. (C) Colocalization of HNRNPK with HCV core and RNA. Huh7hp cells stably expressing the HA-tagged HNRNPKΔNLS mutant were electroporated with HCV RNA as described above. Ha-tagged HNRNPKΔNLS, core and HCV positive-strand RNA were visualized as described above. Enlargements of the sections indicated by white squares are shown in the corresponding lower panels. Images in panels B and C were acquired with a confocal microscope; scale bars refer to 10 µm.

