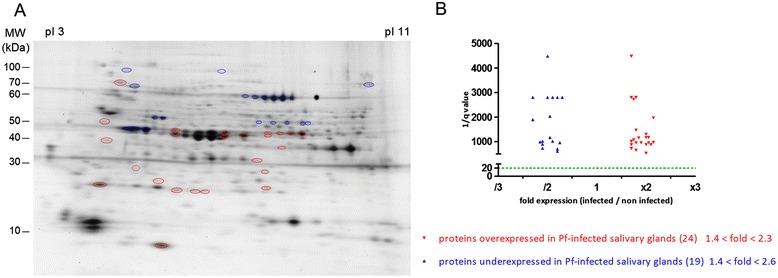
Figure 1.

Differential salivary protein expression of An. gambiae infected or not infected by wild P. falciparum . (A) 2D-DIGE gel. Forty-three differentially expressed spots, and the only spots which have been excised, are indicated by circles. Red circles represent the 24 over-expressed spots and the 19 blue circles represent the under-expressed spots. Proteins were separated in the first dimension using carrier ampholyte gradient gels between pH 3 and pH 11. The second dimension was separated using on 10–20% SDS-PAGE gels. The isoelectric point (pI) and molecular weight scales are indicated in the figure. (B) Differences of protein expression are represented according to the expression ratio (infected/non-infected) and significance ratio (q value). The horizontal dotted line indicates the significance threshold of q < 0.05 (or 1/q > 20) according to the Samespot analysis.
